Wide range in estimates of hydrogen emissions from infrastructure
 Sofia Esquivel-Elizondo1*
  Alejandra Hormaza Mejia2,3
  Tianyi Sun2
  Eriko Shrestha2
  Steven P. Hamburg2
  Ilissa B. Ocko2
- 1Environmental Defense Fund Europe, Amsterdam, Netherlands
- 2Environmental Defense Fund, New York, NY, United States
- 3National Fuel Cell Research Center, University of California, Irvine, Irvine, CA, United States
Hydrogen holds tremendous potential to decarbonize many economic sectors, from chemical and material industries to energy storage and generation. However, hydrogen is a tiny, leak-prone molecule that can indirectly warm the climate. Thus, hydrogen emissions from its value chain (production, conversion, transportation/distribution, storage, and end-use) could considerably undermine the anticipated climate benefits of a hydrogen economy. Several studies have identified value chain components that may intentionally and/or unintentionally emit hydrogen. However, the amount of hydrogen emitted from infrastructure is unknown as emissions have not yet been empirically quantified. Without the capacity to make accurate direct measurements, over the past two decades, some studies have attempted to estimate total value chain and component-level hydrogen emissions using various approaches, e.g., assumptions, calculations via proxies, laboratory experiments, and theory-based models (simulations). Here, we synthesize these studies to provide an overview of the available knowledge on hydrogen emissions across value chains. Briefly, the largest ranges in estimated emissions rates are associated with liquefaction (0.15%–10%), liquid hydrogen transporting and handling (2%–20%), and liquid hydrogen refueling (2%–15%). Moreover, present and future value chain emission rate estimates vary widely (0.2%–20%). Field measurements of hydrogen emissions throughout the value chain are critically needed to sharpen our understanding of hydrogen emissions and, with them, accurately assess the climate impact of hydrogen deployment.
Introduction
Hydrogen (H2) is a feedstock and an energy carrier with huge potential to limit the extent of climate change. Today, H2 is used in specialized industrial applications, such as chemical production and oil refining. Many propose a broad expansion of its use to a wide range of new applications, including renewable energy storage and power generation in industry and transportation, and by so doing have established H2 as a key component of global decarbonization efforts and the energy transition. The successful development of a hydrogen economy (ranging from H2 production to its use) could accelerate a transition to a global low-carbon economy, thereby helping to meet the Paris Agreement objective of limiting global warming to below 2°C (Energy Transitions Commission, 2021; International Energy Agency, 2021). Thus, policymakers and industries worldwide have begun a massive push for hydrogen, investing hundreds of billions of dollars into hydrogen projects (Hydrogen Council, 2021). However, whether the broad deployment of H2 will fulfill its promise to help meet near-term climate goals will depend on how it is produced, managed, and used (Ocko and Hamburg, 2022).
Currently, H2 is overwhelmingly produced from fossil fuels with very high associated levels of climate pollution (i.e., gray H2). Low-carbon H2 can be achieved by including carbon capture and sequestration (CCS) within this process (i.e., blue H2). Near-zero-carbon H2 can be produced from water electrolysis using a diversity of renewable energy sources (wind, solar, and hydro) (i.e., green or electrolytic H2), as well as nuclear energy (i.e., pink H2) (Valente et al., 2017; Zhao et al., 2020; Vilbergsson et al., 2023). Moreover, net zero-carbon H2 can be produced from biomass and renewable energy (i.e., bio H2) (International Energy Agency, 2019). However, achieving climate-neutrality status also requires no hydrogen emissions.
Regardless of how it is produced, the H2 molecule is leak-prone and has indirect warming effects. H2 induces atmospheric perturbations that increase concentrations of three potent greenhouse gases (GHG): methane (CH4), water vapor in the stratosphere (H2O), and ozone in the troposphere (Derwent et al., 2006; 2020; 2001; Field and Derwent, 2021; Paulot et al., 2021; Warwick et al., 2022). Specifically, tropospheric H2 oxidation (H2 + OH = H + H2O) depletes the hydroxyl radical (OH), the primary sink for CH4, leading to a lengthening of the CH4 atmospheric lifetime. Additionally, producing atomic hydrogen (H) from H2 oxidation leads to a chain of reactions that produces tropospheric ozone. Furthermore, when this reaction occurs in the stratosphere, the increased water vapor produced leads to stratospheric cooling due to the enhancement of its radiative capacity, which results in the planet’s overall warming (Ehhalt and Rohrer, 2009; Derwent, 2018).
Hydrogen’s warming effects play out over a period of a couple of decades (Warwick et al., 2023). The latest science suggests that over a 20-year period, H2 can cause 30 to 40 times more warming than CO2 for equal initial emissions in mass (Hauglustaine et al., 2022). Because its impacts are short-lived, hydrogen’s warming potency is around 12 times that of CO2 over 100 years. Thus, the overall climate benefits, especially in the near term, from replacing fossil fuel systems with hydrogen alternatives will depend on how much H2 is emitted.
Studies show that if effectively handled, H2 could bring real climate benefits. With a low emissions rate, green H2 could nearly eliminate climate impacts compared to fossil fuels, and blue H2 could dramatically reduce impacts (Hauglustaine et al., 2022; Ocko and Hamburg, 2022). However, climate benefits decrease significantly with the increase in H2 emissions, posing a risk to decarbonization goals (Hauglustaine et al., 2022; Ocko and Hamburg, 2022; Warwick et al., 2023).
To achieve the promised maximum climate benefits of H2, measures are needed to keep it from escaping into the atmosphere across the entire value chain (i.e., production, conversion, transport/distribution, storage, and end use). However, it is virtually unknown how much H2 is emitted intentionally and unintentionally from hydrogen systems since, to date, these emissions have not been measured, mainly because the instrumentation to measure H2 emissions at low-level concentrations has been lacking. Current commercially available sensors suitable for use in industrial settings can only detect H2 at higher concentrations (i.e., ppm level) that are relevant for ensuring safe operating conditions but not suitable for quantifying overall site-level emissions (Najjar, 2019; Ocko and Hamburg, 2022). Sensors for site-level emissions quantification require high sensitivity (i.e., at the low ppb level), selectivity, and fast response (i.e., in seconds) in situ. However, such sensors are currently unavailable, with a new technology that can fill this gap only recently announced (EDF and Aerodyne, 2023). Accordingly, quantitative studies only analyze H2 leakage with a safety focus, often in confined spaces (Hajji et al., 2015; Parvini and Gharagouzlou, 2015; Kobayashi et al., 2018; Chang et al., 2019; Qian et al., 2020).
Over the past two decades, several studies have attempted to estimate total value chain (Schultz et al., 2003; Tromp et al., 2003; Bond et al., 2011) and component-level H2 emissions to assess the risk of large-scale hydrogen use on the climate (van Ruijven et al., 2011; Arrigoni and Diaz, 2022; Cooper et al., 2022; Fan et al., 2022; Frazer-Nash Consultancy, 2022). Due to the lack of direct measurements, their estimation methods are heavily dependent on assumptions, calculations via proxies, laboratory experiments, or theoretically-based models or simulations. Here, we synthesized these studies to provide a complete picture of our current understanding of H2 emissions sources and magnitudes across the hydrogen value chain. This synthesis is instrumental in identifying research needs and strengthening the integrity of hydrogen initiatives. Specifically, identifying and quantifying H2 emissions from infrastructure will help determine prevention and mitigation opportunities that maximize hydrogen’s decarbonization benefits.
Literature surveyed
The issue of hydrogen emissions from energy infrastructure has enormous climate implications but is vastly understudied. The few studies that have attempted to estimate H2 emissions from the hydrogen economy (Kammen et al., 2003; Schultz et al., 2003; Tromp et al., 2003; Warwick et al., 2004; Bond et al., 2011), hydrogen systems (e.g., H2 fuel cell vehicles (Colella et al., 2005), refueling stations (Genovese et al., 2019)), or a specific value chain component (e.g., liquid H2 [LH2] handling (Petitpas, 2018)) have served as a basis for similar studies that assess the effect of H2 deployment on the atmosphere and the climate (Prather, 2003; Jacobson et al., 2005; Jacobson, 2008; Wuebbles et al., 2010). Further studies have estimated H2 emissions from each value chain component considering previous estimates. This mini-review summarizes these initial attempts to estimate H2 emissions from hydrogen value chains. Notably, we synthesize the studies by van Ruijven et al. (2011), Arrigoni and Diaz (2022), Cooper et al. (2022), Frazer-Nash (2022), and Fan et al. (2022), which are the sole studies that provide hydrogen emissions estimates for total and per-component value chains. Because of the limited number of publications on hydrogen emissions, which are well-known among the community in this field, no specific strategy was employed to find literature on this topic.
Van Ruijven et al. (2011) assumed low and high H2 emissions scenarios based on previously estimated H2 emission rates (Schultz et al., 2003; Colella et al., 2005; Wuebbles et al., 2010). Arrigoni and Diaz (2022) published a technical report based on a 2022 workshop focused on the environmental impacts of hydrogen emissions, which includes the H2 emissions estimates presented by Air Liquide for today and 2030. However, the underlying assumptions/data leading to their reported estimates are not detailed. Cooper et al. (2022) estimated the potential emissions of H2 supply chains in the UK using natural gas supply chain emissions as a proxy. Similarly, Frazer-Nash Consultancy (2022) used natural gas emission estimates and conventional fluid mechanics to predict H2 emissions in a 2050 UK hydrogen economy using a probabilistic model with 50% and 99% confidence intervals. Lastly, Fan et al. (2022) estimated the emissions of different value chain components in 2050 for low- and high-emission cases. For their estimates, they used published emission rates and extrapolated from comparisons with similar technologies (e.g., Alvarez et al., 2012; Hormaza Mejia and Brouwer, 2018; Panfilov, 2016; Petitpas, 2018; Shen et al., 2021; Xia et al., 2019).
Potential sources of H2 emissions throughout the value chain
Hydrogen emissions from hydrogen systems described in the literature can be divided into intentional and unintentional emissions or operational and fugitive emissions (see Supplementary Figure S1). The intentional emissions comprise operational purging and venting (Arrigoni and Diaz, 2022; Cooper et al., 2022; Fan et al., 2022; Frazer-Nash Consultancy, 2022). Most unintentional emissions are assumed to occur because H2 is the smallest molecule and has low molecular weight, high diffusivity, and low viscosity (Völkl and Alefeld, 1975; Fichtner and Idrissova, 2009), making it hard to contain. Therefore, H2 leaks more easily than other molecules managed (e.g., compressed, liquefied), transported, and stored. Accordingly, the reported unintentional and fugitive emissions include leakage from pipework (pipes, valves, joints, traps, assets, seals, etc.) and equipment, diffusion from pipelines, and permeation from where it is stored (e.g., compression or liquefaction tanks, salt caverns, and depleted oil and gas fields). Other unintentional emissions, such as residual H2 in exhaust streams and natural boil-off from liquefied H2, derive from operational procedures.
H2 emissions are likely to occur throughout the value chain, from production, conversion, transport, and storage to end-use applications. Figure 1 and Supplementary Table S1 summarize the type of potential H2 emissions described in the literature for value chain components. The primary potential H2 emissions attributed to H2 production are leakage through pipework and equipment and operational purging for maintenance, removal of impurities, and during fault conditions. Additionally, for blue H2 production, there may be residual H2 in the CO2 stream. Similarly, for green H2 production, the vented O2 stream may carry residual H2 (due to H2 cross-over through the membrane between the electrodes). While venting of process gases is assumed negligible in new blue H2 plants (gases will be sent to flare), venting during startup (venting air within the cathode) and shutdown (to remove moisture and any explosive gas mixture from the system) has been identified as a potential source of H2 emissions in green H2 production (Arrigoni and Diaz, 2022; Frazer-Nash Consultancy, 2022).
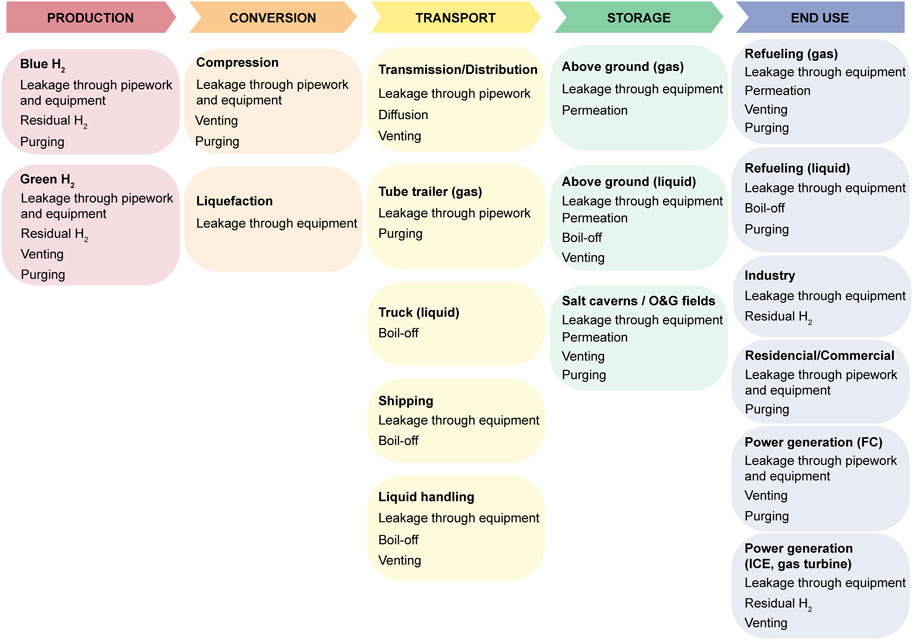
FIGURE 1. Reported potential sources of H2 emissions throughout the value chain. These sources are described in van Ruijven et al. (2011), Arrigoni and Diaz (2022), Cooper et al. (2022), Fan et al. (2022), and Frazer-Nash Consultancy (2022). See Supplementary Table S1 for a more detailed description of the emission sources.
Regarding H2 conversion, potential H2 emissions reported for compression and liquefaction are mainly due to leakage through pipework and equipment (e.g., engine slip and compressor leakage through seals). Planned process venting, pipeline venting (e.g., for maintenance), and purging during startup and shutdown have also been identified as potential emissions sources during compression (Cooper et al., 2022; Frazer-Nash Consultancy, 2022).
As for transportation, potential H2 emissions attributed to transmission and distribution pipelines include pipework and equipment leakage, venting, and diffusion (Arrigoni and Diaz, 2022; Cooper et al., 2022; Frazer-Nash Consultancy, 2022). For the transport of gaseous H2 on road tube trailers, leakage from fittings and valves and purging of the trailer hose have been reported as primary potential emissions sources. Boil-off is the main potential source reported for LH2 trucking. For LH2 handling (e.g., loading/unloading), leakage through equipment and venting, in addition to boil-off, have also been reported (Petitpas, 2018; Arrigoni and Diaz, 2022; Cooper et al., 2022; Frazer-Nash Consultancy, 2022).
The primary potential H2 emissions from H2 storage (above ground as a compressed gas or a cryogenic liquid and below ground in salt caverns and depleted oil and gas fields) include natural permeation and leakages through equipment due to pressurization and depressurization. For aboveground LH2 storage, there are additional identified potential emissions from boil-off and venting when boil-off leads to pressures deemed the safe maximum or releases to avoid getting close to critical pressures. In addition, for underground storage, venting and purging at surface processing plants due to annual maintenance, shutdown, and fault conditions (emergency shutdown) are other potential sources of emissions (Cooper et al., 2022; Fan et al., 2022; Frazer-Nash Consultancy, 2022).
The H2 emissions from the last component of the value chain, end uses, will vary depending on the application (e.g., transport, industrial, power generation with fuel cells, internal combustion engines, or gas turbines). However, emissions from leakages through equipment and purging or venting have been identified as potential sources of emissions across end-uses (Figure 1 and Supplementary Table S1).
Estimated H2 emission rates for value chain components reported to date
To provide a comprehensive overview of potential H2 emissions from each value chain component, we compiled published H2 emission rates and summarized them in Figure 2 and Supplementary Table S2. In the absence of direct measurements, these H2 emission rates were estimated through assumptions, calculations via proxies, laboratory experiments, and theory-based models (simulations). Many of these estimates are based on previously published H2 emissions assumptions and estimates from natural gas systems.
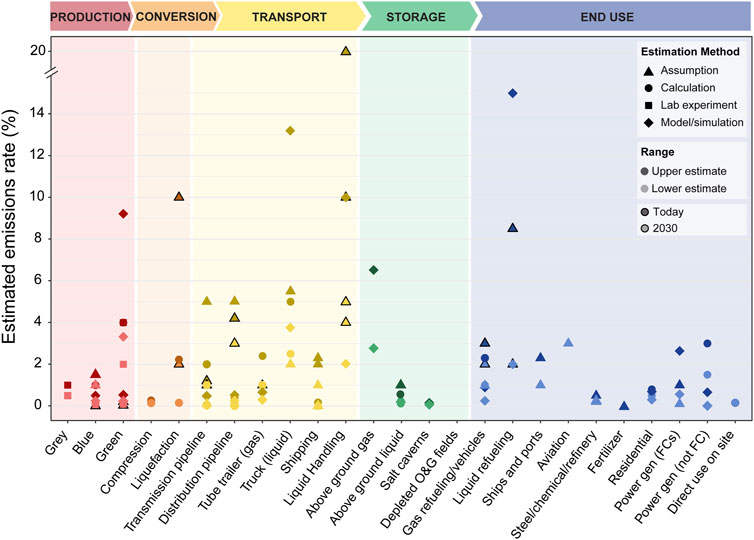
FIGURE 2. H2 emissions rates estimates for value chain components as cited in the literature. The plotted values synthesize the estimates reported by van Ruijven et al. (2011), Arrigoni and Diaz (2022), Cooper et al. (2022), Fan et al. (2022), and Frazer-Nash Consultancy (2022) for several value chain components in addition to the estimates reported by Colella et al. (2005) for gaseous H2 fuel cell vehicles and those by Petitpas (2018) for LH2 handling. Their estimates include assumptions, calculations via proxies, laboratory experiments, and theory-based models (or simulations) and are reported as a percentage of the hydrogen produced, converted, transported/distributed, stored, or used. See the Supplementary Table S2 for a summary of the estimates reported by these references.
The synthesized references report emissions rates as a percentage of hydrogen produced, managed, or used in the respective supply chain component. All studies report ranges except Arrigoni and Diaz (2022), who provide a single estimate for today and 2030. Moreover, while van Ruijven et al. (2011) and Cooper et al. (2022) estimate current H2 emissions, Frazer-Nash Consultancy (2022) and Fan et al. (2022) predict H2 emissions within three decades. It is also important to emphasize that Cooper et al. (2022) and Frazer-Nash’s estimates are specific to UK hydrogen systems. Consequently, due to these differences and the different methodologies used to estimate emissions rates, it is evident in Figure 2 that there is a very wide range of estimates for each value chain component.
For H2 production, estimated emissions rates range between 0.5% and 1.0% for gray H2, 0.0%–1.5% for blue H2, and 0.03%–9.2% for green H2. Blue H2 production may have a higher leakage risk than gray H2 due to additional separation processes (Fan et al., 2022). Green H2 production may have higher emissions than blue and other pathways (e.g., bioH2) due to the higher emission rates associated with electrolysis compared to steam methane reforming and biomass gasification (Cooper et al., 2022).
Estimated emissions rates associated with LH2 have the largest ranges; 0.15%–10.0% for liquefaction, 2.0%–13.2% for LH2 trucking, 2.0%–20% for LH2 handling, and 2.0%–15.0% for LH2 refueling stations. While some studies report emissions specific for liquefaction (Arrigoni and Diaz, 2022; Cooper et al., 2022), LH2 trucking (Fan et al., 2022; Frazer-Nash Consultancy, 2022) or refueling (Petitpas, 2018; Arrigoni and Diaz, 2022), others mention LH2 handling in general (Petitpas, 2018; Arrigoni and Diaz, 2022).
Estimated emissions rates associated with gaseous H2 transport, storage, and use also vary widely; 0.02%–5.0% for transmission pipelines, 0.0003%–5.0% for distribution pipelines, 0.3%–2.3% for transportation on road tube trailers, 2.8%–6.5% for storage above ground, and 0.25%–3.0% for gas refueling stations (including the estimations for gaseous H2-powered vehicles by (Colella et al., 2005)). H2 emissions rates estimated for common end-uses include 0.01%–3.0% for power generation, 1.0%–2.3% for ships and ports, and 3.0% for aviation (Figure 2). It should be noted that some of these emissions rates include emissions from two value-chain components (see details in Supplementary Table S2).
Overall, H2 transport is predicted to generate the most emissions (Frazer-Nash Consultancy, 2022), especially transporting and handling LH2, which implies the need to manage boil-off (Sherif et al., 1997; Petitpas, 2018). Our survey of published emissions estimates makes it clear that more robust data is required to have confidence in the H2 emissions rates for each value chain or its components.
Estimated H2 emission rates of the total value chain
Without empirical data, very little confidence should be placed in total value chain emissions, as they are expected to be highly dependent on the configuration of the pathway and existing technology. To assess the environmental impacts of a potential hydrogen economy, several studies have estimated total H2 emissions rates between 0.2% and 20% from a diversity of value chains (e.g., Bond et al., 2011; Cooper et al., 2022; Warwick et al., 2004; Wuebbles et al., 2010) (Supplementary Table S3). Specifically, van Ruijven et al. (2011) estimated total value chain H2 emissions from 0.2% to 10% based on a per-component configuration. However, this range does not include emissions from production and compression and components of storage and end-use applications (Supplementary Table S2). Comparatively, Frazer-Nash includes components of production, transportation, storage, and several end-use applications but estimates total H2 emissions rates of 0.96%, at 50% confidence, and 1.50%, at 99% confidence. Tromp et al. (2003) estimate total H2 emissions rates between 10% and 20%, mainly due to H2 transport. However, Schultz et al. (2003) indicate that only for extreme individual cases, like uncontrolled evaporation from LH2 storage tanks, would 10%–20% emissions rates be possible. Further studies on the climate impacts of H2 have assumed a range of 1%–10% of total value chain emissions citing previous studies (Derwent et al., 2020; 2001; Prather, 2003; Paulot et al., 2021; Hauglustaine et al., 2022; Ocko and Hamburg, 2022; Warwick et al., 2022).
Discussion
It is unknown whether technological advancements have influenced hydrogen emissions over the last two decades due to the lack of empirical data. This paucity of experimental validation has resulted in a vast range of estimates among studies that attempt to quantify H2 emissions, as they are based on various assumptions that are often poorly supported. For example, Frazer-Nash Consultancy (2022) and Cooper et al. (2022) used the natural gas distribution system and conventional fluid mechanics to estimate H2 emissions. While this might be the only plausible approach, there is a high degree of uncertainty in current CH4 emissions estimates (Alvarez et al., 2018; 2012; Riddick and Mauzerall, 2023), as well as the fluid flow regimes and mechanisms contributing to H2 leakage (Hormaza Mejia et al., 2020).
Accurately assessing the climate impacts of switching to a hydrogen economy requires empirical data on H2 emissions from production through end uses (Figure 1 and Supplementary Table S1). However, until now, accurately measuring site-level H2 emissions was not feasible due to a lack of the high precision fast response instruments required (e.g., ∼10 ppb or 0.01 ppm sensitivity; one to a few seconds response time).
These measurements are critical for several reasons. First, they would support improvements in chemistry-climate models to understand the potential effects of hydrogen deployment on atmospheric composition and radiative forcing (Warwick et al., 2022; Warwick et al., 2023). Second, field measurements of specific value chain components would improve life cycle assessments by accurately accounting for the warming effects from H2 emissions; this would improve comparisons between hydrogen systems and other alternatives to fossil fuels, like direct electrification. Third, measurements would help identify major emission sources and mitigation opportunities to inform best practices.
The H2 emissions magnitudes will depend on the industry scale in the future. Consequently, the industry size will play a major role in how these emissions influence the climate (Dillman and Heinonen, 2023). Nevertheless, mitigating H2 emissions from operational procedures will be essential for maximizing the climate benefits of hydrogen systems. For instance, waste H2 (residual, purged, or vented) could be used to produce process heat and electricity (Frazer-Nash Consultancy, 2022), and boil-off could be recovered (Petitpas, 2018). In electrolytic H2 production, H2 purged during purification and cross-over H2 passing into the O2 chamber could be recombined with O2 and converted back into water rather than vented into the atmosphere. Moreover, leakage can be minimized by tightening valves and seals, and leakage through the casing of electrolyzers and other equipment could be mitigated through laminated gaskets and welded joints (Frazer-Nash Consultancy, 2022).
Lastly, it is important to mention that hydrogen systems have climate implications beyond hydrogen emissions (Kyriakopoulos, 2021; Dillman and Heinonen, 2023). Blue H2 pathways that rely on fossil fuel-based energy sources and have low carbon capture and long-term storage efficiencies result in high greenhouse gas emissions. In addition, the energy efficiency of hydrogen production, storage, and transportation compared to direct electrification has climate implications. Direct electrification of end uses using renewable energy is generally more energy-efficient and has lower GHG emissions than hydrogen systems (Yugo and Soler, 2019; Ueckerdt et al., 2021; Shrestha and Sun, 2023). Thus, using hydrogen (blue, green, or another pathway) in easily electrifiable end-use applications may result in higher overall GHG emissions than direct electrification.
Concluding remarks
Some studies have estimated hydrogen emissions magnitudes from total and per-component value chains with various assumptions and methodologies, leading to a wide range of emissions rate estimates. Based on our literature review, which includes the most extreme upper limits that are often criticized and considered “unrealistic” or “outdated”, we find little basis for characterizing the actual range in H2 emissions rates with reasonable confidence. Therefore, identifying and empirically quantifying H2 emissions throughout the value chain is fundamental.
Fortunately, there is still time to prevent suboptimal outcomes, as most of the hydrogen infrastructure proposed to meet decarbonization targets has yet to be built (Hydrogen Council, 2017; SEBEIS, 2021; Department of Energy, 2022). With accurate measurements of H2 emissions and knowledge of mitigation strategies and best practices, we can reduce the likelihood of developing leaky systems and minimize H2 emissions in the growing H2 value chain, which is critical to ensure the climate benefits we intend to achieve with H2 deployment (Hauglustaine et al., 2022; Ocko and Hamburg, 2022; Warwick et al., 2023).
Author contributions
SH, IO, and TS conceptualized the project. AH, SE-E, and ES collected the information and data. SE-E and IO conducted the data visualization. SE-E wrote the first draft. All authors contributed to the article and approved the submitted version.
Acknowledgments
The authors thank Werner Weindorf, Patrick Schmidt, and Yanni Sandro Astono from the Ludwig-Bölkow-Systemtechnik GmbH consultancy for their insightful discussions on estimated hydrogen emissions rates from infrastructure. We also thank Dr. Jasmine Cooper for her communications on their reported hydrogen emissions estimates. AH thanks Jack Brouwer for his academic support. This manuscript has been released as a pre-print at OSF (Esquivel-Elizondo et al., 2023).
Conflict of interest
The authors declare that the research was conducted in the absence of any commercial or financial relationships that could be construed as a potential conflict of interest.
Publisher’s note
All claims expressed in this article are solely those of the authors and do not necessarily represent those of their affiliated organizations, or those of the publisher, the editors and the reviewers. Any product that may be evaluated in this article, or claim that may be made by its manufacturer, is not guaranteed or endorsed by the publisher.
Supplementary material
The Supplementary Material for this article can be found online at: https://www.frontiersin.org/articles/10.3389/fenrg.2023.1207208/full#supplementary-material
References
Alvarez, R. A., Pacala, S. W., Winebrake, J. J., Chameides, W. L., and Hamburg, S. P. (2012). Greater focus needed on methane leakage from natural gas infrastructure. PNAS 109, 6435–6440. doi:10.1073/pnas.1202407109
Alvarez, R. A., Zavala-Araiza, D., Lyon, D. R., Allen, D. T., Barkley, Z. R., Brandt, A. R., et al. (2018). Assessment of methane emissions from the U.S. oil and gas supply chain. Science 361, 186–188. doi:10.1126/science.aar7204
Arrigoni, A., and Diaz, B. L. (2022). Hydrogen emissions from a hydrogen economy and their potential global warming impact. Belgium, Germany: European Commission, Joint Research Center.
Bond, S. W., Gül, T., Reimann, S., Buchmann, B., and Wokaun, A. (2011). Emissions of anthropogenic hydrogen to the atmosphere during the potential transition to an increasingly H2-intensive economy. Int. J. Hydrogen Energy 36, 1122–1135. doi:10.1016/j.ijhydene.2010.10.016
Chang, Y., Zhang, C., Shi, J., Li, J., Zhang, S., and Chen, G. (2019). Dynamic Bayesian network based approach for risk analysis of hydrogen generation unit leakage. Int. J. Hydrogen Energy 44, 26665–26678. doi:10.1016/J.IJHYDENE.2019.08.065
Colella, W. G., Jacobson, M. Z., and Golden, D. M. (2005). Switching to a U.S. hydrogen fuel cell vehicle fleet: The resultant change in emissions, energy use, and greenhouse gases. J. Power Sources 150, 150–181. doi:10.1016/J.JPOWSOUR.2005.05.092
Cooper, J., Dubey, L., Bakkaloglu, S., and Hawkes, A. (2022). Hydrogen emissions from the hydrogen value chain-emissions profile and impact to global warming. Sci. Total Environ. 830, 154624–624. doi:10.1016/j.scitotenv.2022.154624
Department of Energy, (2022). DOE National clean hydrogen strategy and roadmap. Washington, D.C., USA.
Derwent, R. G., Collins, W. J., Johnson, C. E., and Stevenson, D. S. (2001). Transient behaviour of tropospheric ozone precursors in a global 3-D CTM and their indirect greenhouse effects. Clim. Change 49, 463–487. doi:10.1023/A:1010648913655
Derwent, R. G. (2018). Hydrogen for heating: Atmospheric impacts. https://assets.publishing.service.gov.uk/government/uploads/system/uploads/attachment_data/file/760538/Hydrogen_ atmospheric_impact_report.pdf.
Derwent, R. G., Stevenson, D. S., Utembe, S. R., Jenkin, M. E., Khan, A. H., and Shallcross, D. E. (2020). Global modelling studies of hydrogen and its isotopomers using STOCHEM-CRI: Likely radiative forcing consequences of a future hydrogen economy. Int. J. Hydrogen Energy 45, 9211–9221. doi:10.1016/j.ijhydene.2020.01.125
Derwent, R., Simmonds, P., O’doherty, S., Manning, A., Collins, W., and Stevenson, D. (2006). Global environmental impacts of the hydrogen economy. Int. J. Nucl. Hydrogen Prod. Appl. 1, 57–67. doi:10.1504/IJNHPA.2006.009869
Dillman, K., and Heinonen, J. (2023). Towards a safe hydrogen economy: An absolute climate sustainability assessment of hydrogen production. Climate 11, 25. doi:10.3390/cli11010025
EDF and Aerodyne (2023). As climate concerns about hydrogen energy grow, new tech unveiled at CERAWeek delivers unprecedented results measuring leaks, other emissions. URL https://www.businesswire.com/news/home/20230305005045/en/As-Climate-Concerns-About-Hydrogen-Energy-Grow-New-Tech-Unveiled-at-CERAWeek-Delivers-Unprecedented-Results-Measuring-Leaks-Other-Emissions.
Ehhalt, D. H., and Rohrer, F. (2009). The tropospheric cycle of H<sub>2</sub>: A critical review. Tellus B Chem. Phys. Meteorol. 61, 500. doi:10.1111/j.1600-0889.2009.00416.x
Energy Transitions Commission (2021). Making the hydrogen economy possible: Accelerating clean hydrogen in an electrified economy. London, UK: Energy Transitions Commission.
Fan, Z., Sheerazi, H., Bhardwaj, A., Corbeau, A.-S., Longobardi, K., Castañeda, A., et al. (2022). Hydrogen leakage: A potential risk for the hydrogen economy. New York, NY, USA: Columbia University.
Fichtner, M., and Idrissova, F. (2009). “Fundamental properties of hydrogen,” in The hydrogen economy: Opportunities and challenges (Cambridge, United Kingdom: Cambridge University Press), 271–276.
Field, R. A., and Derwent, R. G. (2021). Global warming consequences of replacing natural gas with hydrogen in the domestic energy sectors of future low-carbon economies in the United Kingdom and the United States of America. Int. J. Hydrogen Energy 46, 30190–30203. doi:10.1016/j.ijhydene.2021.06.120
Frazer-Nash Consultancy, (2022). Fugitive hydrogen emissions in a future hydrogen economy. United Kingdom: Frazer-Nash Consultancy.
Genovese, M., Blekhman, D., Dray, M., and Fragiacomo, P. (2019). Hydrogen losses in fueling station operation. J. Clean. Prod. 248, 119266. doi:10.1016/j.jclepro.2019.119266
Hajji, Y., Jouini, B., Bouteraa, M., Elcafsi, A., Belghith, A., and Bournot, P. (2015). Numerical study of hydrogen release accidents in a residential garage. Int. J. Hydrogen Energy 40, 9747–9759. doi:10.1016/J.IJHYDENE.2015.06.050
Hauglustaine, D., Paulot, F., Collins, W., Derwent, R., Sand, M., and Boucher, O. (2022). Climate benefit of a future hydrogen economy. Commun. Earth Environ. 3, 295. doi:10.1038/s43247-022-00626-z
Hormaza Mejia, A., Brouwer, J., and mac Kinnon, M. (2020). Hydrogen leaks at the same rate as natural gas in typical low-pressure gas infrastructure. Int. J. Hydrogen Energy 45, 8810–8826. doi:10.1016/j.ijhydene.2019.12.159
Hormaza Mejia, A. N., and Brouwer, J. (2018). Gaseous fuel leakage from natural gas infrastructure. New York, NY, USA: American Society of Mechanical Engineers ASME.
Hydrogen Council, (2021). Hydrogen insights report 2021. https://hydrogencouncil.com/en/hydrogen-insights-2021/.
Hydrogen Council, (2017). Hydrogen scaling up. https://hydrogencouncil.com/en/study-hydrogen-scaling-up/.
International Energy Agency (2021). Global hydrogen review 2021. https://www.iea.org/reports/global-hydrogen-review-2021.
International Energy Agency (2019). The future of hydrogen. https://www.iea.org/reports/the-future-of-hydrogen.
Jacobson, M. Z., Colella, W. G., Golden, D. M., Frey, M. M., and Hanna, E. (2005). Snowfall-driven growth in east antarctic ice sheet mitigates recent sea-level rise. Science 308, 1898–1901. doi:10.1126/science.1110662
Jacobson, M. Z. (2008). Effects of wind-powered hydrogen fuel cell vehicles on stratospheric ozone and global climate. Geophys Res. Lett. 35, L19803. doi:10.1029/2008GL035102
Kammen, D. M., Lipman, T. E., Lovins, A. B., Lehman, P. A., Eiler, J. M., Tromp, T. K., et al. (2003). Assessing the future hydrogen economy. Science 302, 226–229. doi:10.1126/science.302.5643.226b
Kobayashi, H., Naruo, Y., Maru, Y., Takesaki, Y., and Miyanabe, K. (2018). Experiment of cryo-compressed (90-MPa) hydrogen leakage diffusion. Int. J. Hydrogen Energy 43, 17928–17937. doi:10.1016/j.ijhydene.2018.07.145
Kyriakopoulos, G. L. (2021). “Should low carbon energy technologies be envisaged in the context of sustainable energy systems?,” in Low carbon energy technologies in sustainable energy systems (Amsterdam, Netherlands: Elsevier), 357–389. doi:10.1016/B978-0-12-822897-5.00015-8
Najjar, Y. S. (2019). Hydrogen leakage sensing and control: (Review). Biomed. J. Sci. Tech. Res. 21, 16228–16240. doi:10.26717/bjstr.2019.21.003670
Ocko, I. B., and Hamburg, S. P. (2022). Climate consequences of hydrogen emissions. Atmos. Chem. Phys. 22, 9349–9368. doi:10.5194/acp-22-9349-2022
Panfilov, M. (2016). “4 - underground and pipeline hydrogen storage,” in Compendium of hydrogen energy. Editors R. B. Gupta, A. Basile, and T. N. Veziroğlu (Sawston, United Kingdom: Woodhead Publishing), 91–115.
Parvini, M., and Gharagouzlou, E. (2015). Gas leakage consequence modeling for buried gas pipelines. J. Loss Prev. Process Ind. 37, 110–118. doi:10.1016/J.JLP.2015.07.002
Paulot, F., Paynter, D., Naik, V., Malyshev, S., Menzel, R., and Horowitz, L. W. (2021). Global modeling of hydrogen using GFDL-AM4.1: Sensitivity of soil removal and radiative forcing. Int. J. Hydrogen Energy 46, 13446–13460. doi:10.1016/j.ijhydene.2021.01.088
Petitpas, G. (2018), LLNL-TR-750685. Livermore CA, USA: Lawrence Livermore National Laboratory.Boil-off losses along LH2 pathway
Prather, M. J. (2003). An environmental experiment with H2? Science 302, 581–582. doi:10.1126/science.1091060
Qian, J. Y., Li, X. Y., Gao, Z. X., and Jin, Z. J. (2020). A numerical study of hydrogen leakage and diffusion in a hydrogen refueling station. Int. J. Hydrogen Energy 45, 14428–14439. doi:10.1016/J.IJHYDENE.2020.03.140
Riddick, S. N., and Mauzerall, D. L. (2023). Likely substantial underestimation of reported methane emissions from United Kingdom upstream oil and gas activities. Energy Environ. Sci. 16, 295–304. doi:10.1039/d2ee03072a
Schultz, M. G., Diehl, T., Brasseur, G. P., and Zittel, W. (2003). Air pollution and climate-forcing impacts of a global hydrogen economy. Science 302, 624–627. doi:10.1126/science.1089527
SEBEIS (2021). UK hydrogen strategy. https://assets.publishing.service.gov.uk/government/uploads/system/uploads/attachment_data/file/1011283/UK-Hydrogen-Strategy_web.pdf.
Shen, L., Zavala-Araiza, D., Gautam, R., Omara, M., Scarpelli, T., Sheng, J., et al. (2021). Unravelling a large methane emission discrepancy in Mexico using satellite observations. Remote Sens. Environ. 260, 112461. doi:10.1016/j.rse.2021.112461
Sherif, S. A., Zeytinoglu, N., and Veziroglug, T. N. (1997). Liquid hydrogen: Potential problems, and a proposed research program. Int. J. Hydrogen Energy 22, 683–688. doi:10.1016/s0360-3199(96)00201-7
Shrestha, E., and Sun, T. (2023). Rule #1 of deploying hydrogen: Electrify first. URL https://blogs.edf.org/energyexchange/2023/01/30/rule-1-of-deploying-hydrogen-electrify-first/.
Tromp, T. K., Shia, R.-L., Allen, M., Eiler, J. M., and Yung, Y. L. (2003). Potential environmental impact of a hydrogen economy on the stratosphere. Potential Environ. impact a hydrogen Econ. Stratos. 300, 1740–1742. doi:10.1126/science.1085169
Ueckerdt, F., Bauer, C., Dirnaichner, A., Everall, J., Sacchi, R., and Luderer, G. (2021). Potential and risks of hydrogen-based e-fuels in climate change mitigation. Nat. Clim. Chang. 11, 384–393. doi:10.1038/s41558-021-01032-7
Valente, A., Iribarren, D., and Dufour, J. (2017). Harmonised life-cycle global warming impact of renewable hydrogen. J. Clean. Prod. 149, 762–772. doi:10.1016/j.jclepro.2017.02.163
van Ruijven, B., Lamarque, J. F., van Vuuren, D. P., Kram, T., and Eerens, H. (2011). Emission scenarios for a global hydrogen economy and the consequences for global air pollution. Glob. Environ. Change 21, 983–994. doi:10.1016/j.gloenvcha.2011.03.013
Vilbergsson, K. V., Dillman, K., Emami, N., Ásbjörnsson, E. J., Heinonen, J., and Finger, D. C. (2023). Can remote green hydrogen production play a key role in decarbonizing europe in the future? A cradle-to-gate lca of hydrogen production in Austria, Belgium, and Iceland. Int. J. Hydrogen Energy 48, 17711–17728. doi:10.1016/j.ijhydene.2023.01.081
Völkl, J., and Alefeld, G. (1975). “Hydrogen diffusion in metals,” in Diffusion in solids: Recent developments. Editors A. S. Nowick, and J. J. Burton (New York, NY, USA: Academic Press), 231–302.
Warwick, N., Griffiths, P., Keeble, J., Archibald, A., and Pyle, J. (2022). Atmospheric implications of increased hydrogen use. https://assets.publishing.service.gov.uk/government/uploads/system/uploads/attachment_data/file/1067144/atmospheric-implications-of-increased-hydrogen-use.pdf.
Warwick, N. J., Archibald, A. T., Griffiths, P. T., Keeble, J., O’connor, F. M., Pyle, J. A., et al. (2023). Atmospheric composition and climate impacts of a future hydrogen economy. Atmos. Chem. Phys. Prepr., doi:10.5194/acp-2023-29
Warwick, N. J., Bekki, S., Nisbet, E. G., and Pyle, J. A. (2004). Impact of a hydrogen economy on the stratosphere and troposphere studied in a 2-D model. Geophys Res. Lett. 31. doi:10.1029/2003gl019224
Wuebbles, D. J., Dubey, M. K., Edmonds, J., Layzell, D., Olsen, S., Rahn, T., et al. (2010). “Evaluation of the potential environmental impacts from large-scale use and production of hydrogen in energy and transportation applications,”. DOE/07GO17109 (Denton, Texas, United States: UNT Digital Library). doi:10.2172/1044180
Xia, X., Zhou, H., Zhang, Y., and Jiang, H. (2019). Innovative steam methane reforming for coproducing CO-free hydrogen and syngas in proton conducting membrane reactor. AIChE J. 65. doi:10.1002/aic.16740
Yugo, M., and Soler, A. (2019). A look into the role of e-fuels in the transport system in Europe (2030-2050) (literature review). https://www.concawe.eu/wp-content/uploads/E-fuels-article.pdf.
Keywords: hydrogen economy, hydrogen value chain, hydrogen emissions, hydrogen leakage, hydrogen leaks
Citation: Esquivel-Elizondo S, Hormaza Mejia A, Sun T, Shrestha E, Hamburg SP and Ocko IB (2023) Wide range in estimates of hydrogen emissions from infrastructure. Front. Energy Res. 11:1207208. doi: 10.3389/fenrg.2023.1207208
Received: 17 April 2023; Accepted: 26 July 2023;
Published: 04 August 2023.
Edited by:
Siamak Hoseinzadeh, Sapienza University of Rome, ItalyReviewed by:
Kevin Dillman, University of Iceland, IcelandGrigorios L. Kyriakopoulos, National Technical University of Athens, Greece
Copyright © 2023 Esquivel-Elizondo, Hormaza Mejia, Sun, Shrestha, Hamburg and Ocko. This is an open-access article distributed under the terms of the Creative Commons Attribution License (CC BY). The use, distribution or reproduction in other forums is permitted, provided the original author(s) and the copyright owner(s) are credited and that the original publication in this journal is cited, in accordance with accepted academic practice. No use, distribution or reproduction is permitted which does not comply with these terms.
*Correspondence: Sofia Esquivel-Elizondo, sesquivelelizondo@edf.org